Big Data Analysis with PySpark on OMRON connect Data
Apr 2021 ~ OMRON Healthcare Europe
Length: 1mo (at 1.0 FTE)
Programming languages:
- Python (PySpark, datetime, NumPy, collections,
Pandas, Matplotlib, seaborn)
- SQL
Data: Over 4 million blood pressure measurements registered via OMRON connect by
approximately 35 000 users, including the systolic, diastolic, and pulse of each measurement,
the time and date, the device used, as well as some extra features the device sensors detected, such
as whether the cuff wrap was set properly or if it was too loose
Problem description:
Analyze data to gather insights about the OMRON devices, the OMRON connect app, and its
users' blood pressure
Approach & Results:
After the data was read as a PySpark dataframe, it was preliminarily inspected by counting
the number of records, displaying the available features, their types, the number of missing
values, and the distinct values in the most important columns. Then, the blood pressure
measurements with values outside the realm of possibility were removed. Next, additional
variables were extracted from the device code using UDFs, namely the device type (upper arm
or wrist), cuff type (soft or hard), and its measuring technique (inflation or deflation).
Finally, a new variable suggesting the success of each measurement was generated based on
the signals registered by the sensors of each device. For example, if the device assessed
the cuff wrap as too loose, the measure was declared unsuccessful.
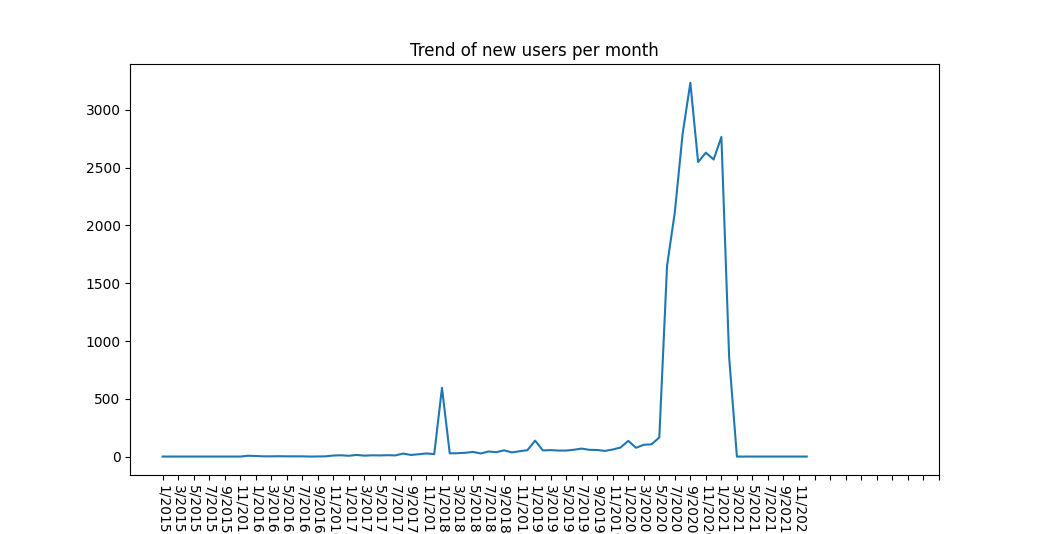
Following the feature engineering and data cleansing, the number of new users per month was
computed taking the first blood pressure measurement submitted by each user and aggregating
them per month. Accordingly, the trend was represented in the time plot below and one can
see that starting from 2018, there is a spike in new users at the beginning of the year,
perhaps due to New Year resolution or holiday presents. Additionally, the graph shows a
dramatic increase from May 2020 that is most likely associated with the COVID-19 pandemic.

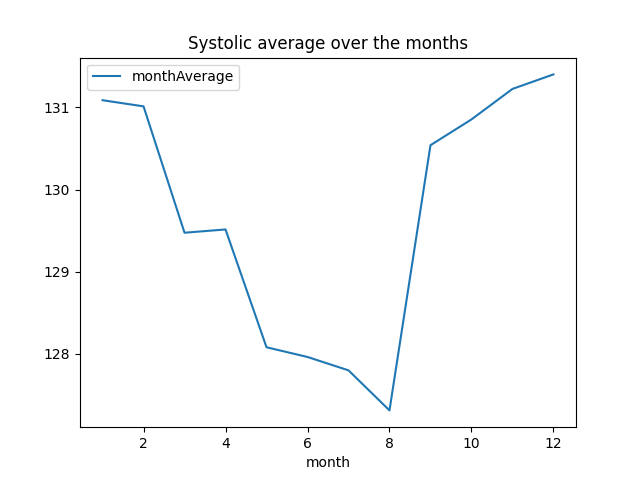
Another trend analyzed is the development of blood pressure over the months. For this, the
measurements were grouped per month and averaged using spark.sql. Accordingly, it was
discovered that during the hot season, the average blood pressure drops significantly in
comparison with the colder period, which aligns with previous specialized research.

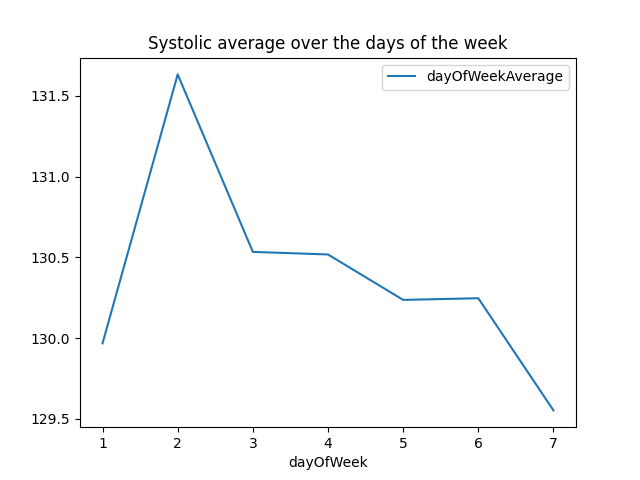
Similarly, the blood pressure was then represented over the days of the week and pictured,
as expected, a decrease in the last part of the week.

Investigating the success rates of device types it was found that upper arm devices outperform
wrist devices by approximately 35%. In order to see what is provoking the errors, the data
from the sensors was further investigated. Subsequently, half the errors were attributed to
the position sensor of the wrist devices, leaving the company an important insight.
Lastly, the study addressed the users who changed their devices. More exactly, the number
of devices that are most often being replaced and the ones which are favorite to upgrade to
were counted.
Consequently, this analysis pointed out how the OMRON devices are performing and comparing
against each other, but also how the users are using the app and how their BP varies over
time. The large amount of data analyzed gives credibility to the insights and helps OMRON
Healthcare to make informed business decisions.